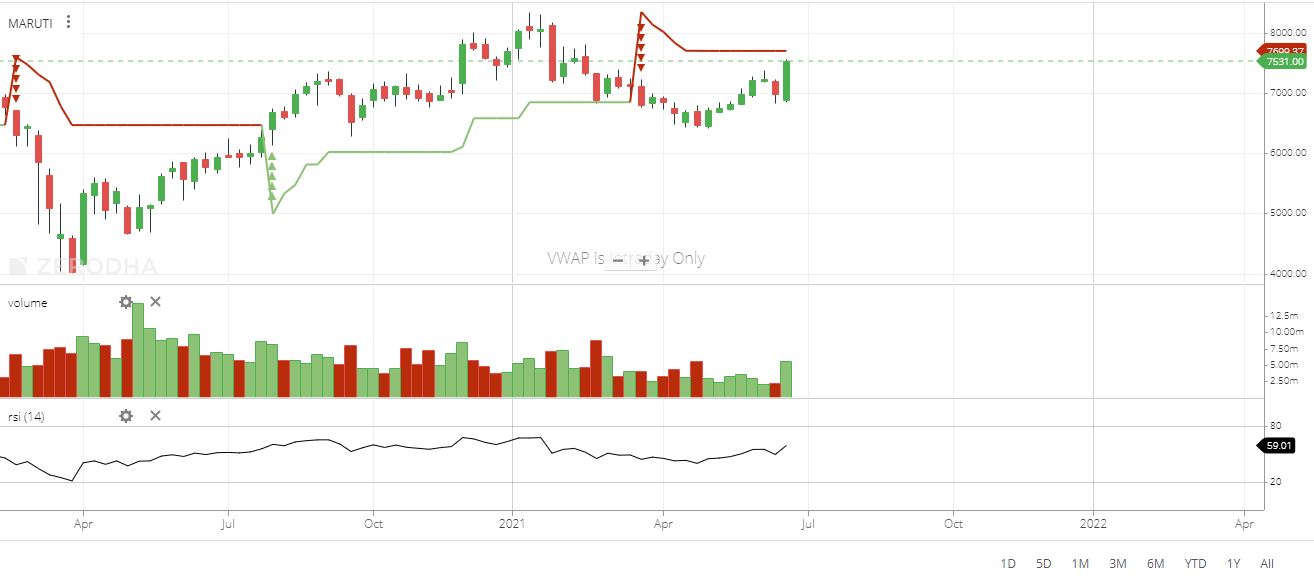
Maruti Suzuki India is currently trading at the 7500 levels, and a critical automobile maker is expected to cross 10000, if demand sustains by year end, 2021. It is a good stock for long-term investment, but the moving average does not show much volume. Besides, technical indicators and the signal line are bullish sometimes; they can lead to a trap. Our analysis highly suggests to follow news and look out for short term opportunities, including RSI levels. Weekly chart shows full candle, a pure bullish sign in stock market.
Demand is picking up for the company, with retails reaching 85-90 percent of post-COVID levels. Furthermore, a move in demand toward entry-level cars is anticipated to favor Maruti, which dominates the segment. Maruti Suzuki has yet to make any big announcement about the debut of electric vehicles, despite rising demand and competition. Mahindra set to launch an electric version of the KUV100 this year. Electric version of the XUV300 is also expected following period.
In automaker categories, competition is fears with its counterparts Nissan Magnate and Kia Sonet. Although Maruti Brezza has superseded Hyundai Venue in sales, but Brezza does not have enough competitive features in the long run. Also, the price level compared to value is high for retail consumers. The chart clearly shows some uptrend movement. The oscillator indicators are bullish and trading with average volume. The chart pattern is bullish as of 3rd December but may change as other NSE stocks price changes.
VWAP, Supertrend, Volume Chart
The weekly chart has only one signal Supertrend, which is enough to determine technical analysis. Maruti share price is pumping near the Supertrend line. The exponential moving averages(EMA) cannot be determined accurately due to low volume. The car manufacturing companies suffered huge losses during the pandemic, and markets have been bearish from March 2021 post second wave. This has impacted fundamental and Maruti’s technical analysis. The returns from Maruti stocks are promising. The company trades in both BSE and NSE India stock exchanges. Investors can also use mutual funds to change in Maruti shares using discounted brokers in India like AliceBlue.
Last year, CCI has ordered a probe against Maruti for conflict with the resale price that impacted the stock market’s real-time stock price. When we hear such news, selling happens in gigantic volumes. As per the accumulation/distribution chart, stock still shows a bullish trend.
Bollinger bands of Maruti stock
The Bollinger bands show prices near the bullish zone, but 7500 support is crucial to rallying in markets. The share has been volatile on since June 2021 .
Maruti Suzuki has also introduced several incentives to lure buyers back to the showroom. There is a 15,000 rupee exchange bonus for every old car sold: Maruti – Suzuki India Ltd. (MSIL) and 20,500 Rs for each new vehicle. Older cars sold through Maruti Suzuki will receive a conversion bonus of up to Rs 10,800 for the first year and a conversion bonus of Rs 20,300 for two years, and for new cars of the same model year, there will also be a conversion bonus of Rs 5,200.
The leading Indian car manufacturer was founded in 1981 under the name Maruti Udyog Limited and joined the Japanese car company Suzuki, in October 1982, which changed its name to Maruti Suzuki Limited.
According to the company, the company’s primary business is limited to India’s production, distribution, marketing, sales, and marketing of vehicles and services. Its services include propulsion through service, vehicle maintenance, repair, maintenance, and repair.
In summary of Maruti’s technical analysis, the stock shows some positive signs, but due to lack of volume, it is challenging to identify the resistance level. It is recommended to follow the Supertrend line, Volume and profit booking with 30-50 points. Also, Short term and long term movements cannot be determined just based on real-time pricing.
