Good Morning Asian traders. It is an interesting bank nifty in the Indian stock market, as banks recovered yesterday’s low siting the meeting of Finance minister with the industrialist. In the global cue, the market Dow and the rest of the US market have recovered from yesterday’s abyss. It is a good positive signal for the Indian stock market.
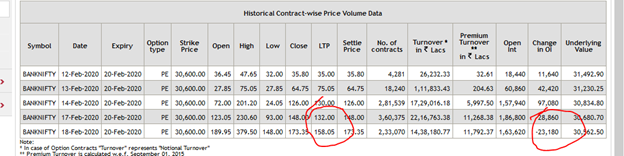
On the other hand, looking at following historical OI data of bank nifty, CE indicates short building and PE indicates short covering. However, it is waiting and watch the game when the Indian stock market opens.
30600 CE

30500 PE
The nifty has similar data. The following historical data shows the short build-up for CE and PE as well.

On the other side of the world, the Coronavirus official death toll is now 2000. There is no significant movement in crude oil that could make or break the rally. In the auto sector, major companies are in the process to resume their operation after the product was slow down due to the coronavirus.
Inequity, Jubilant is showing consolidation and crossover happening. We could see a trend direction if the market responds positively.

Tata Motors shows the sign of recovery by crossing the VWAP by big volume candle in last. The following analysis from the Zerodha chart shows a long build-up in tata motors. If it crosses 180 with big volume then it good for long positions.

Yes, bank high sells volume candle that indicates we may see more downtrend in the coming days. This assumption is solely based on yesterday’s chart. The nifty has already started the process to remove it from the nifty 50 lists.

Coal India has recovered, and we can see that by following big trend reversal. If the pattern continues for another 3-4 days, then we could see rally up to 200. Again, this is solely based on charts, there could be the possibility of fundamental news from ministry for coal India.

For MUTHOOTFIN, it will be waiting and watch again. After a big rally, it is tracing below the VWAP and super trend indicator. The 2 big candles with volume breaking VWAP can help to rally the course.

For ICICI bank we may see touching the 580-590 range if bank and global cues support the bank nifty. It is the strongest stock in the bank nifty that did not fall when there was a major fall happening in the Indian stock market.
