
Video explanation of SBI stock:
State bank of India has given close to a 30% return in the past year. It means have you had Rs 100 investment done in State Bank of India share, you would have received Rs 130 with a profit of 30 points/rupees. It is the largest bank in India and has more than 100+ international branches. The bank provides consistent dividends every year. It also has investments in other companies like Kotak banks that are rallying in stock markets.
The following graph displays the exact picture of last year and where the growth started. We need to focus on three price points, first 280, second 310, third 340. If the stock purchased at 280, at 310, returns would be 15%, and at 310, performance would be
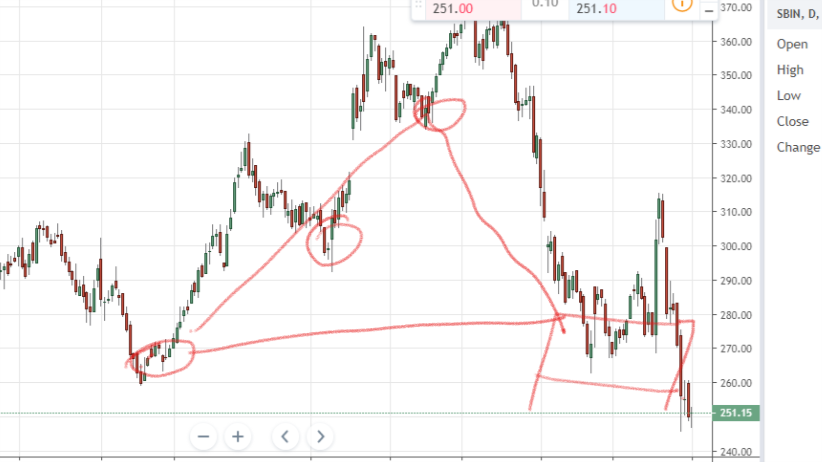
In addition to that, the June quarter reported 2312 crore rupees profits, which are substantial is the amount of profit considering the given economic situation of India.
Recent shareholding reports show little addition of inventions compared to the early announcement. HDFC Trustees and ICICI prudential funds are major public shareholders in the state bank equity. It has also investments in some of its stake traded funds.
The state bank of India chart shows, currently stock is moving back and forth between 250-280 and forming a triangle pattern. A year ago, the same trend occurred with a strong uptrend.
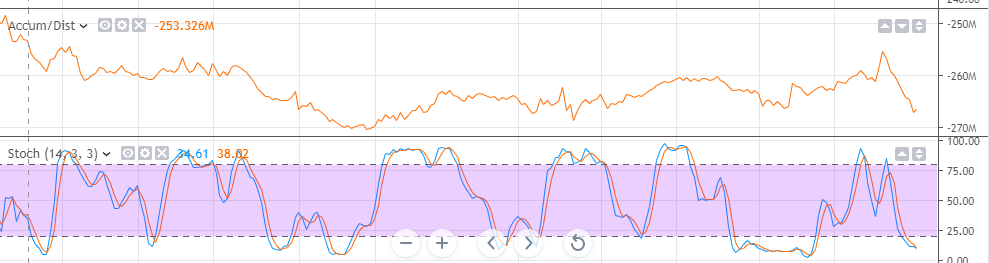
The stochastic trend pattern with the time of 1 period shows oversold positions. Accumulation distribution shows a profile towards a stabilizing mode, favorable to market conditions.
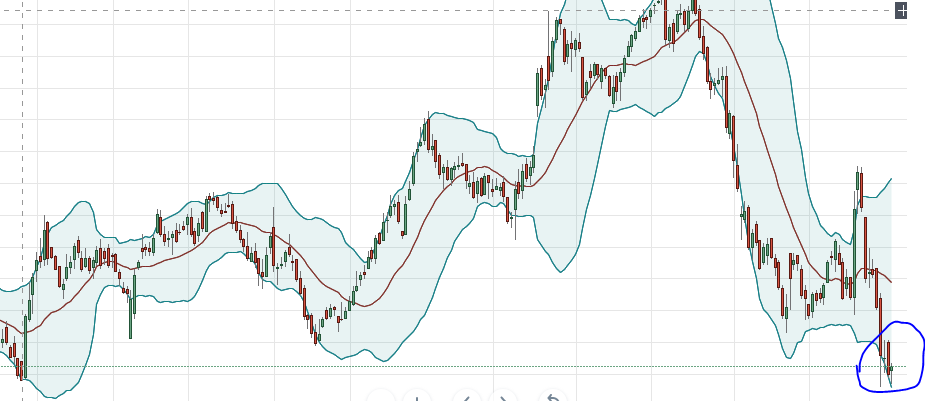
The Bollinger bonds for the same 12 months period shown in the above image show the trend has touched the border, which many times indicate the trend reversal. In Bollinger bonds, when a chart trend line or charts contacts any of the borderline, the trends start to reverse. And when they break out of bounds, then the stock is highly volatile and may fall or rise beyond imagination — the indicator named after famous inventor John Bollinger.
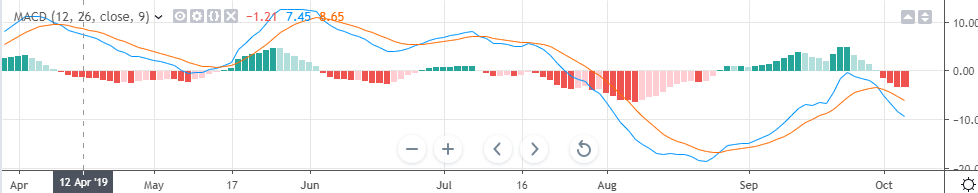
The MACD indicator shows the starting of the trend below the margin line. In MACD, pattern every direction that is below the market strategy is starting to move in an upward trend once it has touched the bottom of the chart line. MACD indicators only have two sections, upper blocks chart, and a lower block chart. If the price is continuously falling, then maps will show tilted upside down below the margin line. If the price is rising, then the table will usually be upside along with the trend line. The most impact factor trend line starts to show upside movement when it touches the bottom peak of the chart.
The repo rate has to reduce to 5.15%. It has impacted the market price. However, it does not mean that the repo rate is going to affect the bank’s profit margin. They are small steps toward significant development efforts. And public sectors tend to feel panic because most of the amateur traders do not even have an idea what a repo rate means. A repo rate is the price rate at which banks loans money from Reserve Bank of India.